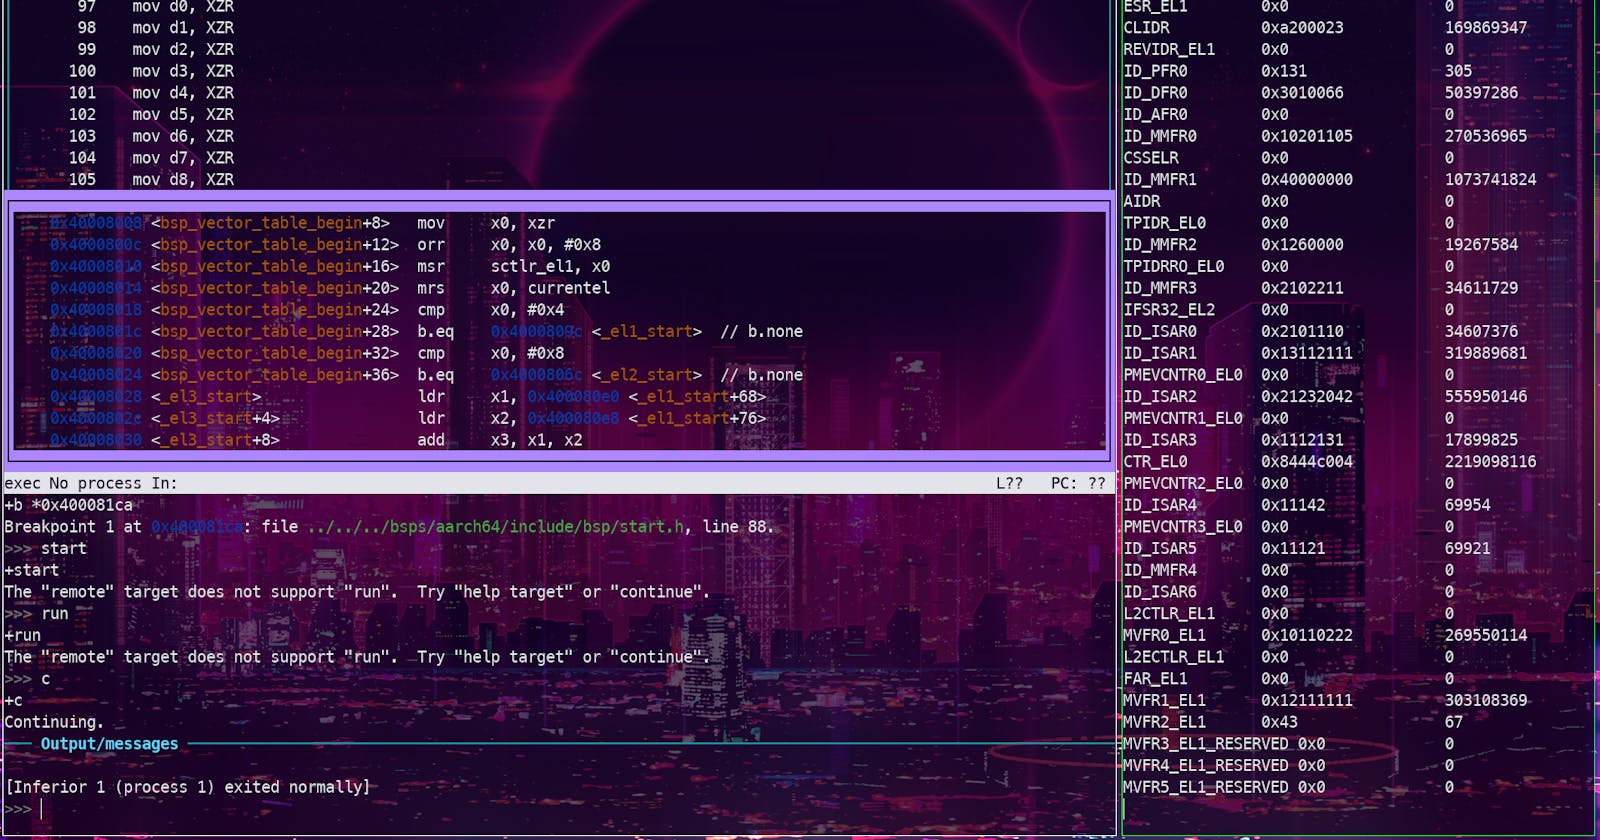
So on today's blog, I'll be talking about how to use GDB with raspberry pi 4 b and with added some lifehacks which will make your debugging go brrrr
So first of all you need to setup raspberry pi with openocd, if you dont know how to do that, you can check my previous blog on how to setup openocd with raspberry pi
Few basic Commands
Before getting started, Here are few useful commands to get started with gdb:-
run or r –> executes the program from start to end.

break or b –> sets breakpoint on a particular line.

disable -> disable a breakpoint.

enable –> enable a disabled breakpoint.

next or n -> executes next line of code, but don’t dive into functions.

step –> go to next instruction, diving into the function.

list or l –> displays the code.

print or p –> used to display the stored value.

quit or q –> exits out of gdb.

clear –> to clear all breakpoints.

continue –> continue normal execution.
In order to know more about these code, you can refer to more capable guide rather mine, you'll get more insights than i can explain :) Although I can recommend some of the best guides.
developers.redhat.com/blog/2021/04/30/the-g..
web.stanford.edu/class/archive/cs/cs107/cs1..
interrupt.memfault.com/blog/advanced-gdb
Debugging the RPi
Now we can move to the Raspberry pi. First of all you need to prepare a kernel for Raspberry pi to boot into. This can be kernel of your choice but I would recommend to go for a bare metal with loop with debugging info. You might wonder why I'm recommending a loop kernel. This is because kernel would keep on running on and it'll give you enough time to set breakpoints and break into the code or if you want to load a different kernel on the go because Raspberry pi doesn't have a TSRT pin and wont halt on the starting of the kernel with openOCD's halt init command.
I'll break at the starting of the kernel which 0x80000 for the AArch64 kernel.
Then i'll jump to the same address.
If you want to load another kernel, you can do that by using load command.
There you go debugging your RPi and everything you want to do. JTAG + GDB is the coolest thing I've discovered so far.
Tricks and Hacks
TUI history
You might have (or will) notice that while in the TUI mode, you can't scroll up in the commands section. Only you can scroll the source or asm. One thing you can do is reverting back to cmd line mode by ctrl + a then x. Kinda like tmux. But swtiching every time would make it cumbersome to do right? So I found a little hack for it. Enter the folllowing into GDB.
set trace-commands on
set logging on
Then open a new terminal, cd to where your gdb is running then tail -f gdb.txt
With this you can keep of track of everything you enter and the outputs of gdb
GUI for GDB
There are quite a few GUI available for gdb, I tried some of them but I still liked the old TUI based mode. Maybe you might like these GUI :)
gdbgui is a browser-based frontend to GDB, built by Chad Smith
Seer is a simple to use debugger based on QT5
GDBFrontend is an easy, flexible and extensionable gui debugger. Try it online
There are mode tons out there, they can be found. here.
.gdbinit file
One of the best thing you can do with gdb is creating an init file which would do all of the commands that you type whenever you start gdb. You can type all that command file and they'll be executed everytime you start gdb. You can even define a lot of other commands which will you can excute with one go. Like the example of kernel loop I've told you about. I'll take an example of what my mentor uses for a Beagle blackbone.
define reset
    echo -- Reset target and wait for U-Boot to start kernel.\n
    monitor reset
    # RTEMS U-Boot starts at this address.
    tbreak *0x80000000
    # Linux starts here.
    tbreak *0x82000000
    continue

    echo -- Disable watchdog.\n
    set *(uint32_t*)0x44e35048=0xAAAA
    while (*(uint32_t*)0x44e35034 != 0)
    end
    set *(uint32_t*)0x44e35048=0x5555
    while (*(uint32_t*)0x44e35034 != 0)
    end

    echo -- Overwrite kernel with application to debug.\n
    load
end
There are a lot more you can do with GDB, if you know some, share them out with me :)
